Designed for Real-World Manufacturing Complexity
In the real world, production doesn’t run to plan.
Materials arrive late. Machines go down. Changeovers take longer than expected. Priorities shift overnight. And yet schedules are still expected to hold.
EvoAPS is built for this reality — not for idealised factory models.
Complexity isn’t the exception - it’s the norm
Traditional scheduling tools struggle because they assume stability: fixed rules, predictable flows, and limited variation. When disruption hits, planners are forced to rebuild schedules manually, often under pressure and without time to explore alternatives.
EvoAPS takes a different approach.
Instead of trying to force one “perfect” plan, it continuously explores many viable options, evaluating how each one performs against your priorities. That means complexity isn’t something to work around — it’s something the system is designed to handle.
Built to reflect how factories actually operate
EvoAPS can model the realities that make scheduling hard, including:
- Sequence-dependent changeovers
- Alternative routings and parallel production lines
- Finite capacity, shift patterns, and maintenance windows
- Material dependencies and availability constraints
- Batch, oven, and concurrent-processing resources
- Multi-stage operations with interdependencies
- Both discrete and process manufacturing environments
This ensures schedules reflect what can happen on the shop floor — not just what looks good on paper.
Responding to disruption without starting again
When conditions change, EvoAPS doesn’t require planners to rebuild schedules from scratch.
Instead, it:
- Re-evaluates options in the background
- Explores alternative strategies in parallel
- Preserves near-term stability through fixed planning windows
- Allows rapid re-optimisation further ahead
This reduces disruption on the shop floor while maintaining agility where it matters.
Complexity handled computationally — not manually
As operations grow, complexity increases faster than headcount can realistically scale. EvoAPS absorbs that complexity computationally, removing the burden from individuals and reducing reliance on heroic manual effort.
Planners and leaders can focus on decisions, trade-offs, and outcomes — not on wrestling with the mechanics of rescheduling.
In Summary
EvoAPS doesn’t simplify reality to make scheduling easier.
It embraces complexity — and gives manufacturers a smarter way to operate within it.
By handling real-world constraints, disruption, and variability head-on, EvoAPS turns complexity from a source of stress into a source of control.
Quick Look
Summary Overview
Summary of the schedules processed and the overall time using EvoAPS.

All schedules overview
View of all process pending, running and complete.
In here the user can manually run a schedule and specify when they may want a result completed by. There is also an option to run the process with or without material constraints and with or without secondary constraints.

Comparisons Window
This again contains schedules, but these are only ones that have an external baseline to compare themselves with. The user has the option to take an existing baseline (providing nothing has changed) and re-run this against a new strategy. Allowing minimum data transfer to done when choosing to manually run concurrent strategies.
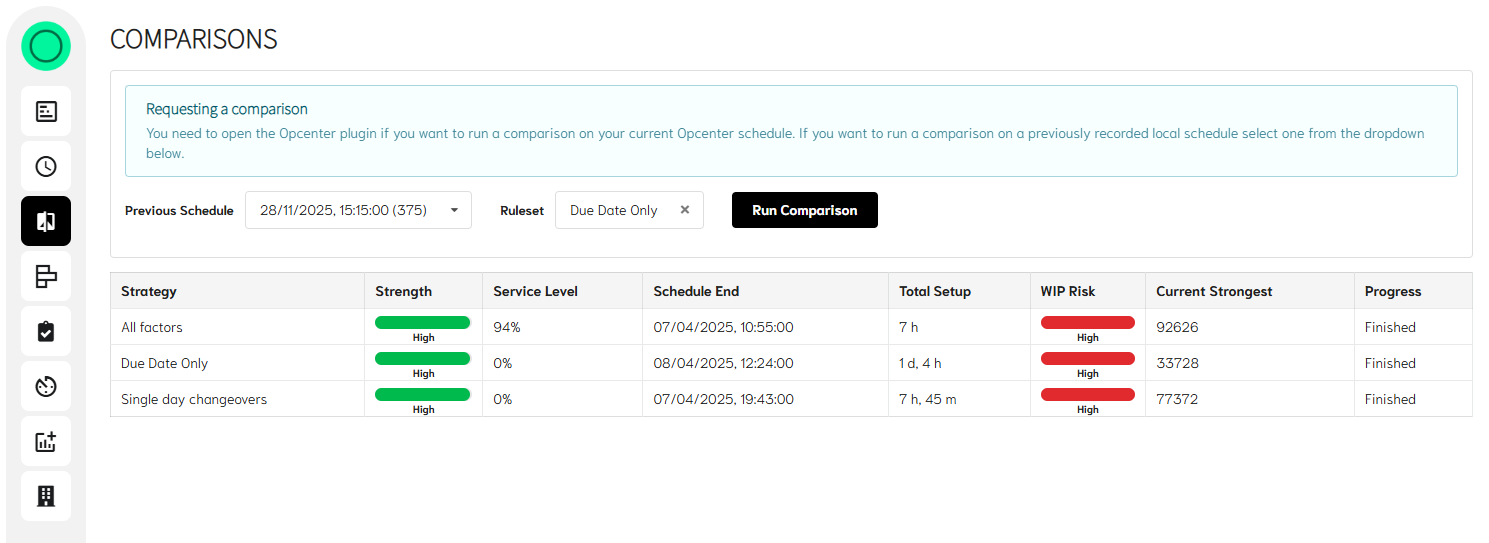
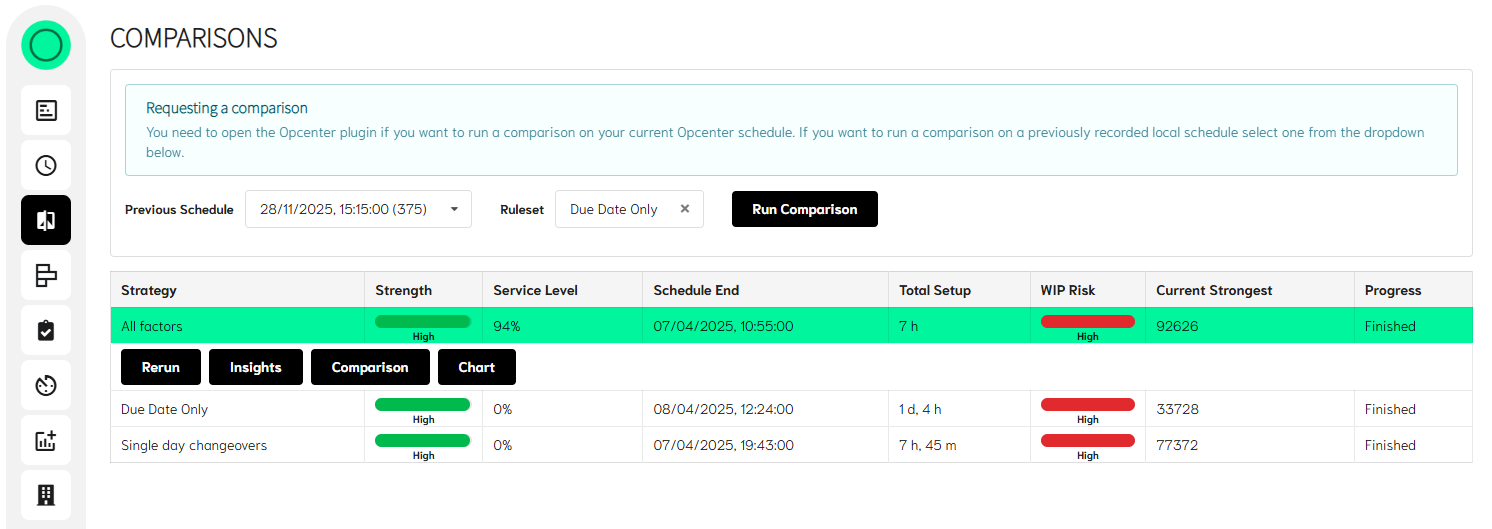
The differences between the two schedules can be viewed simply clicking on the desired result row, even before processing is complete. And selecting the ‘Comparison’ option.
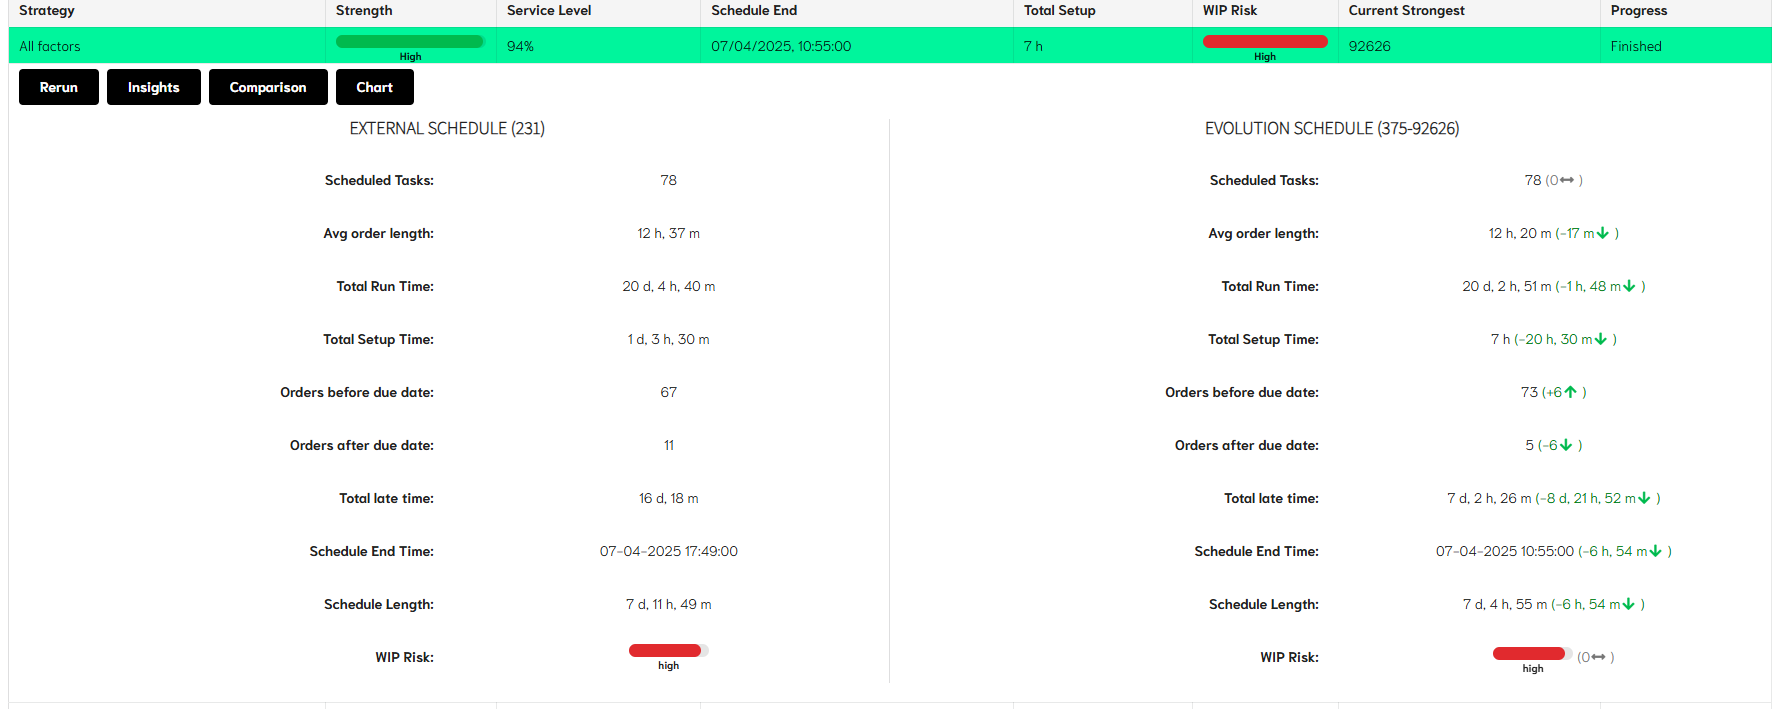
The comparison shows the baseline schedule that is currently in place displayed in the left-hand column alongside the results from EvoAPS in the column on the right.
The differences between the two schedules are shown in brackets, with green highlighting an improvement and red showing a negative change.
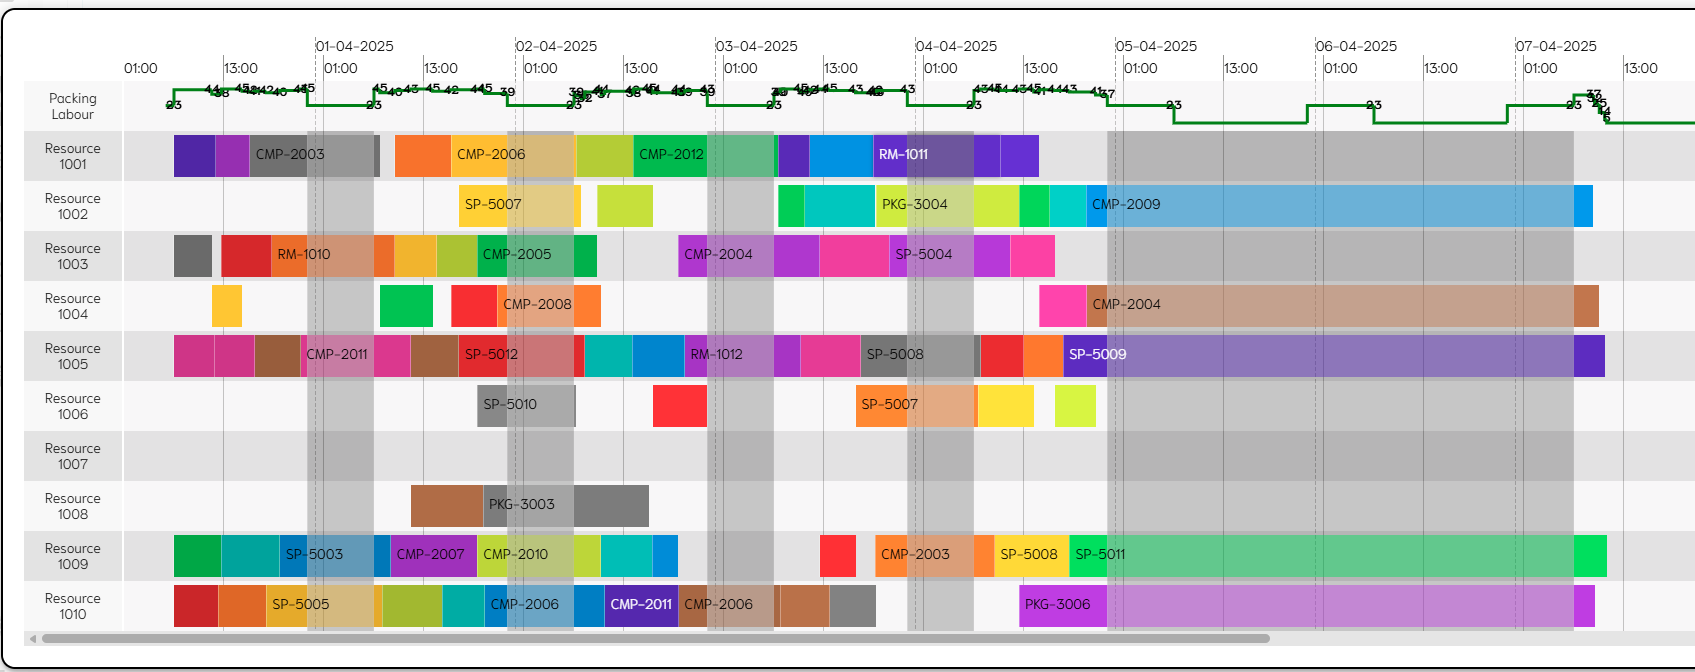
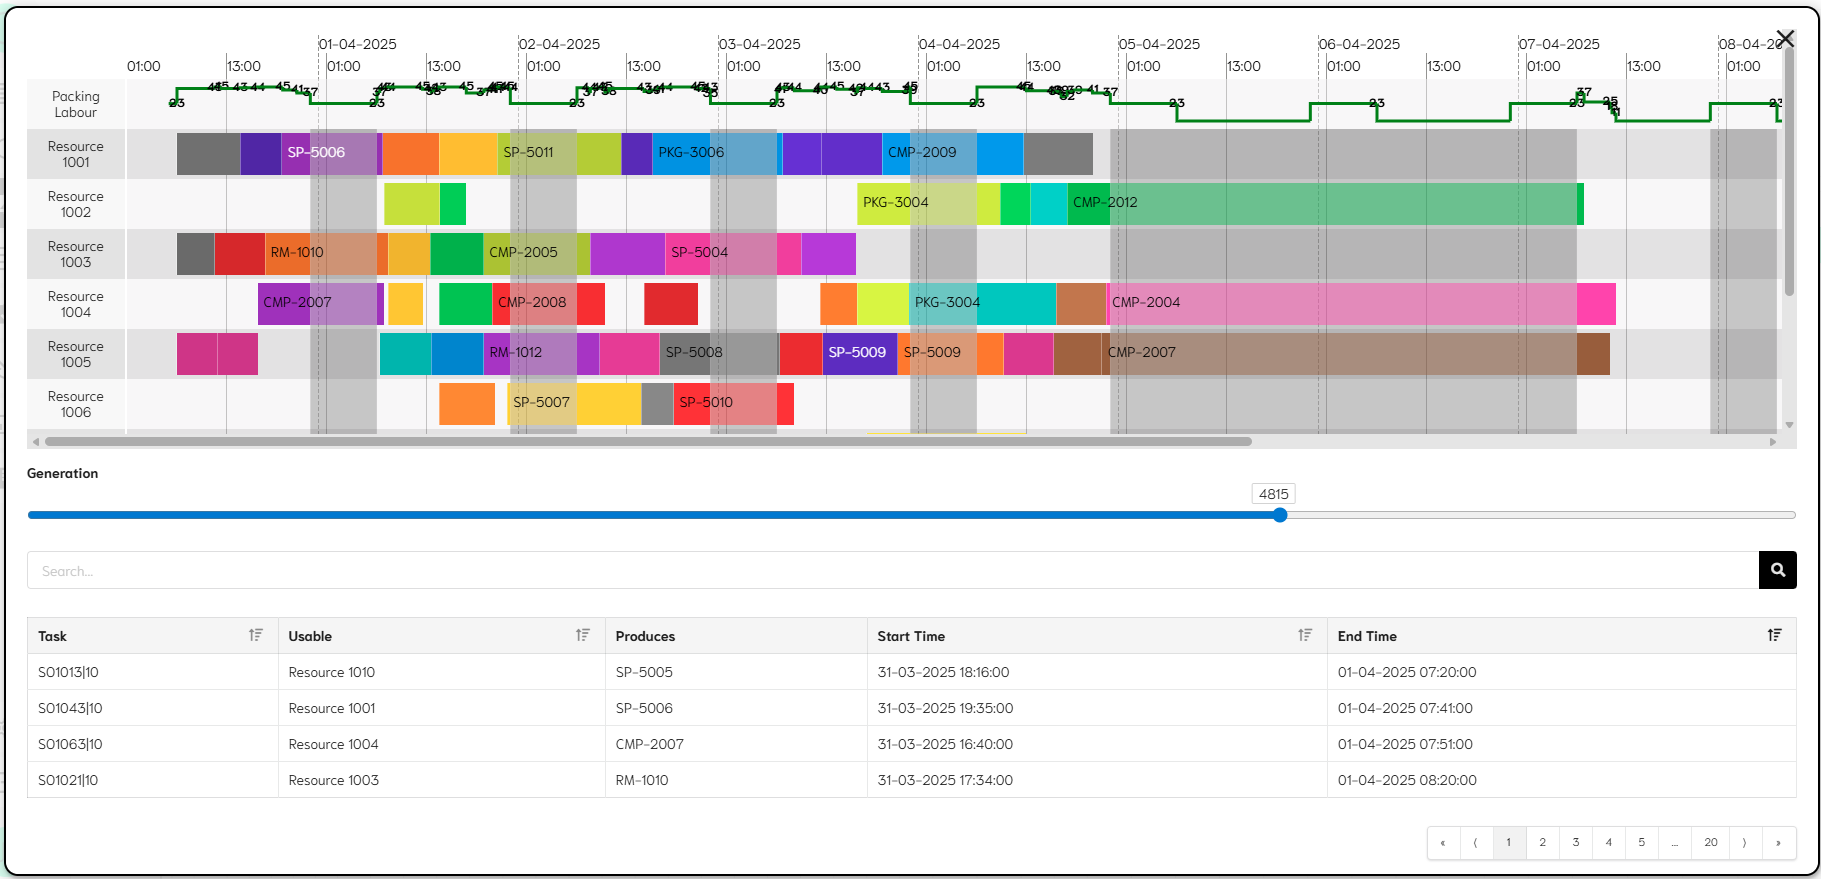
A simple ‘read only’ Gantt chart is also available for viewing the final schedule. With any secondary constraints shown as a simple graph to track usage.
The generation history showing when and how improvements in the Evo results were achieved, can be viewed in by selecting the Insights option.
This allows any improvements found by the evolutionary algorithm to be viewed and the strategies and their impact on results to be more easily understood.
As the number of completed schedules increases, and the improvements made, these can be seen visually on the Generation History graph below. The graph shows each element of the strategy represented along the generation timeline and indicates when a change to that element occurs. Combined, these elements make up the overall fitness result of the schedule.
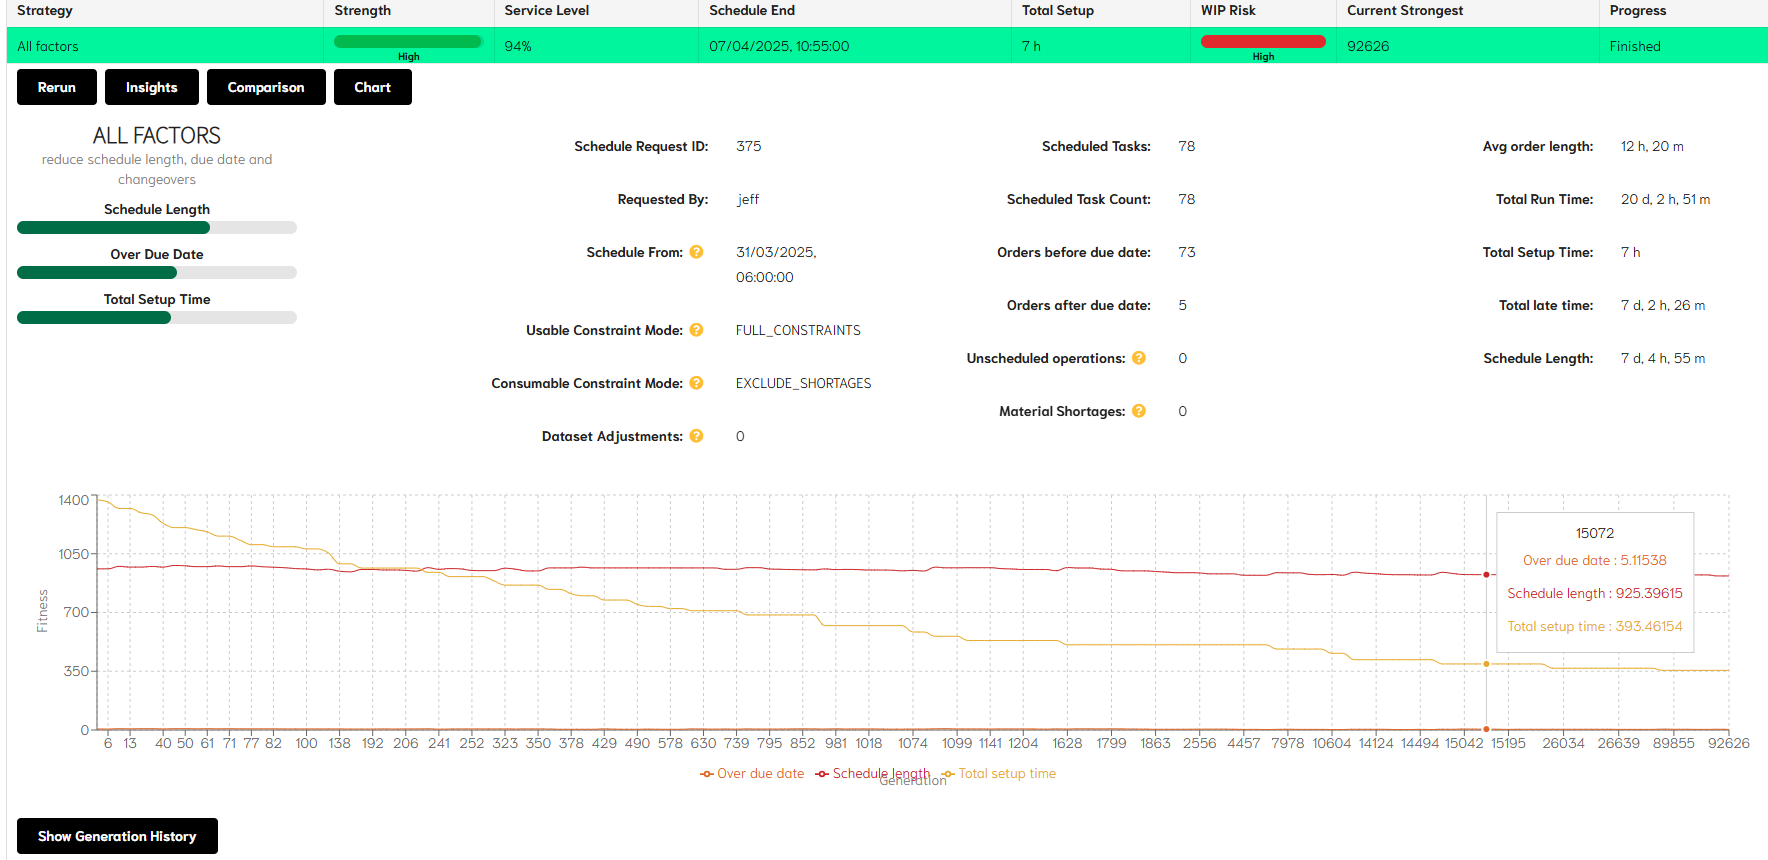
More detail on each generation is available in both a Gantt chart and tabular format by selecting the ‘Show Generation History’ button. This allows the user to scroll between the generations and see the chart and the table update in line with each change.
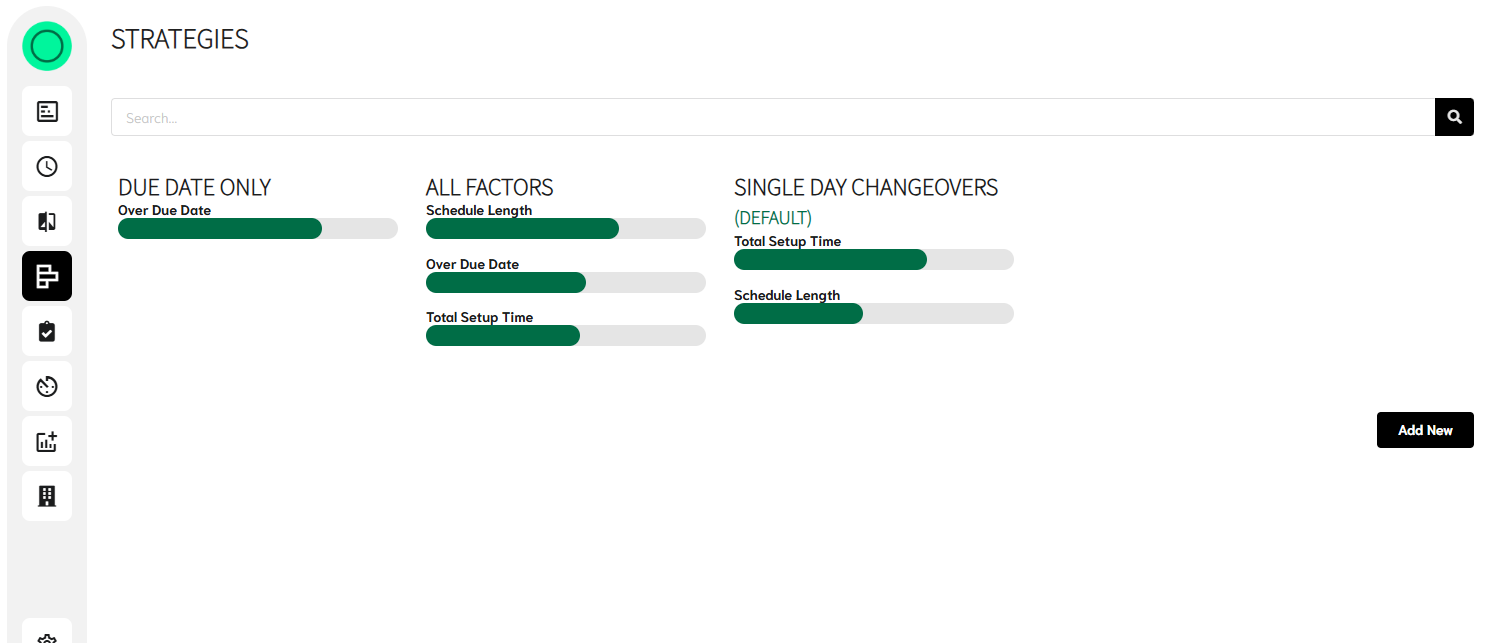
Strategy controls
This shows the user the strategies currently in place within their model in EvoAPS and the specified default strategy. Providing the access level of the user login is sufficient, existing strategies can be adjusted and new strategies created.
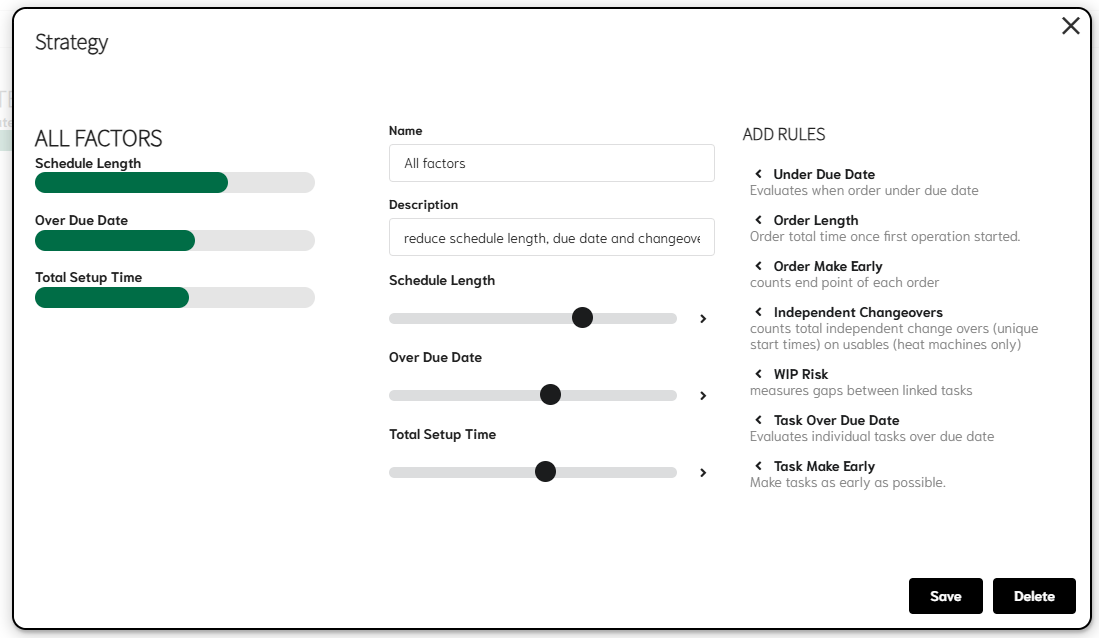
Simply but selecting a strategy the detail of the strategy will open. Adjusts can be made using the sliders or new rules added or existing ones removed.
New strategies can be built using the same logic. By selecting the ‘Add New’ option.
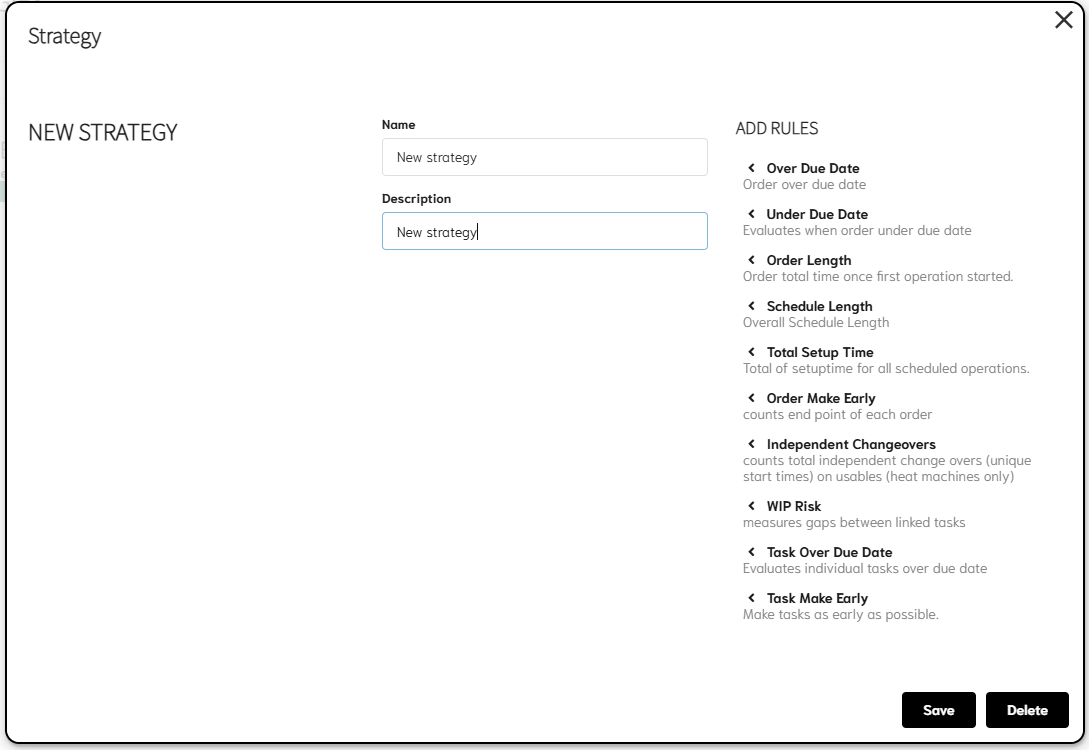
The desired rules can now be added and the weighting set according to the user’s preference.
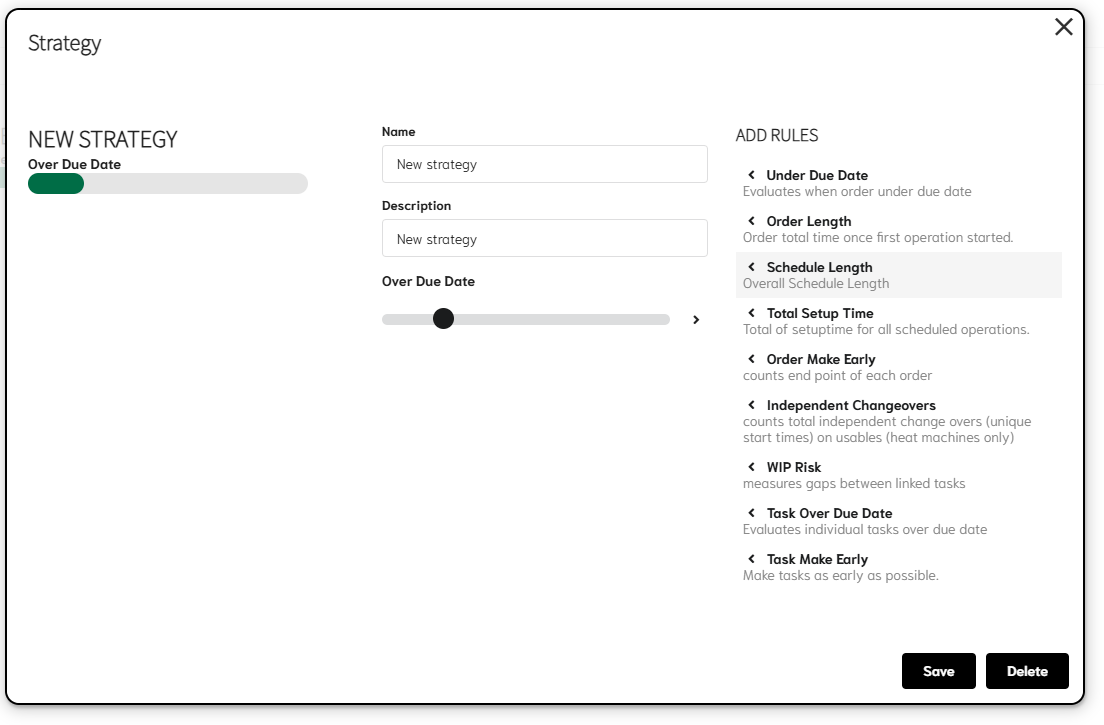
The strategy is now used to help understand what is important to the result.
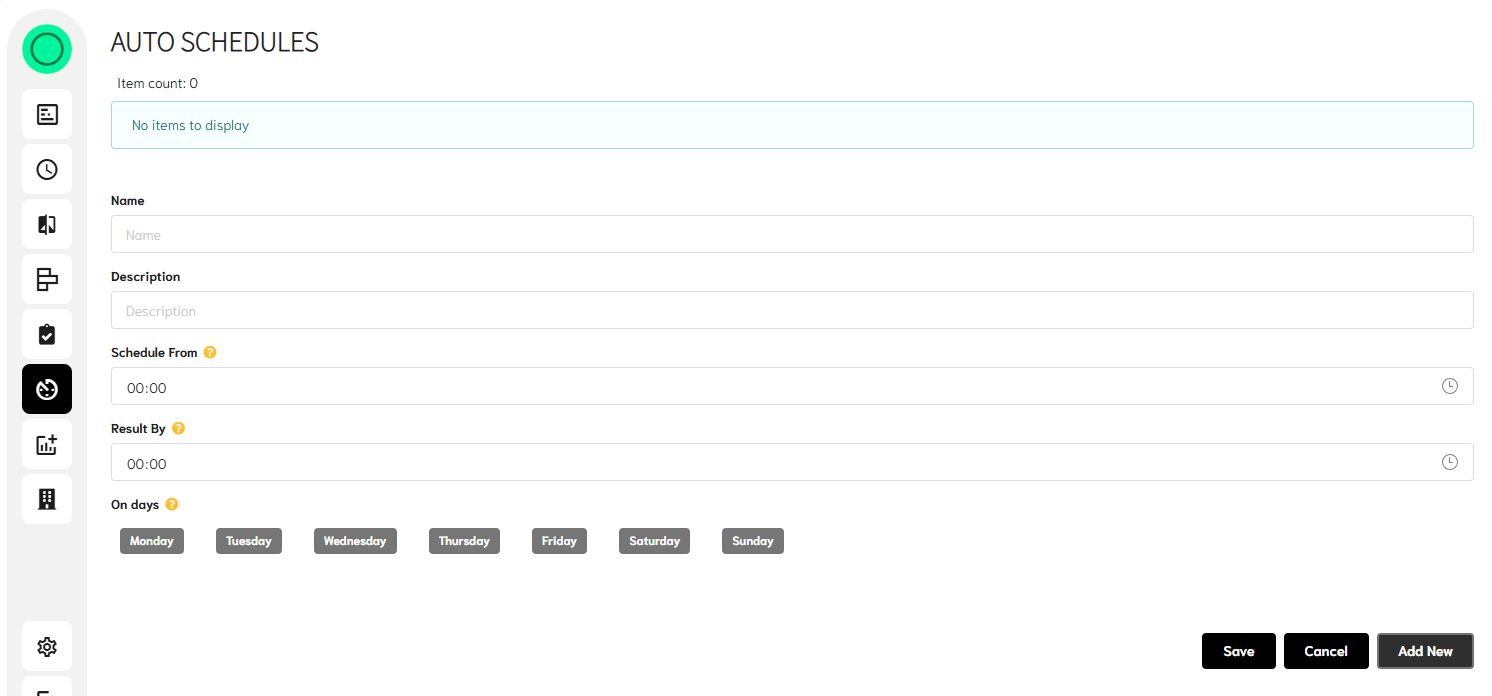
Auto schedules
This allows the set-up an automatic re-schedule and when the result is required to be completed by. This of course requires different elements to also be in place when this is run, but these too can be automated if the data is available.
Resource data
All data that is transferred to EvoAPS can be viewed in this tab.
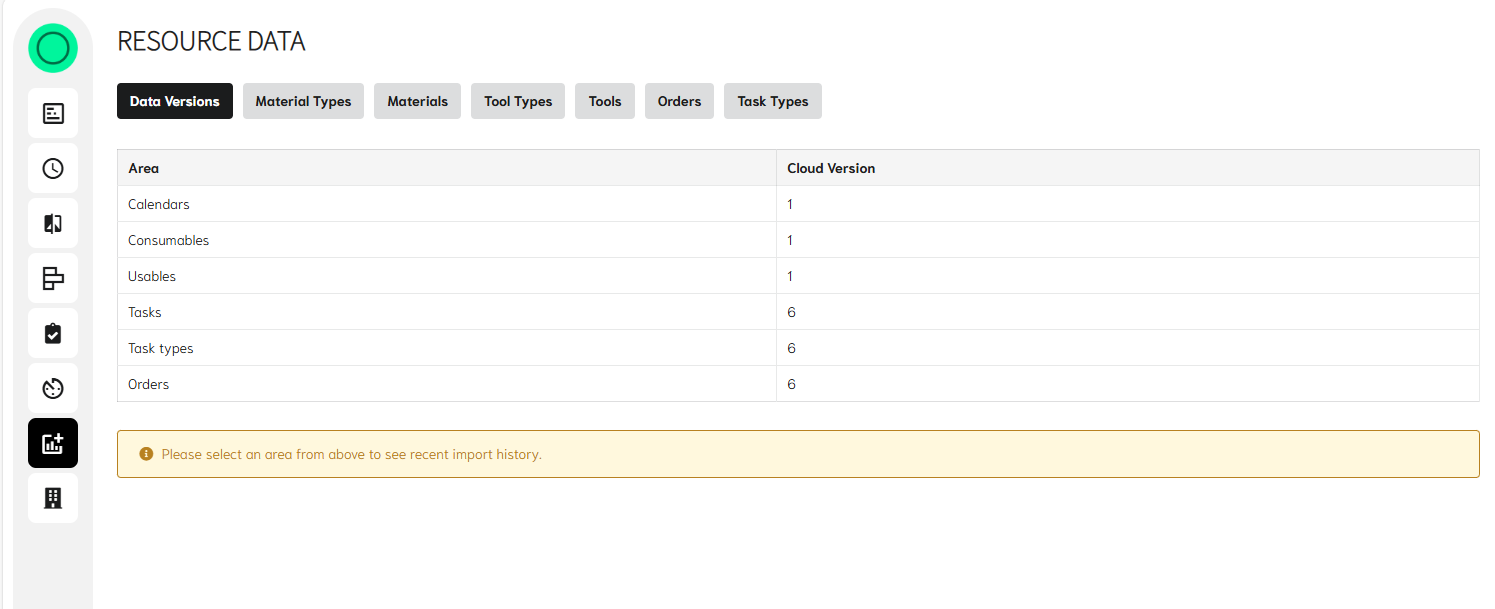
This includes:
- Material types, but internal and external
- Materials available (i.e. stock and future Purchase orders)
- Tool types and how the constraints will work across them
- Tools - primary resources and secondary resources
- Orders – list of all the requirements to schedule
- Task types – list of all operations, run speeds, setup times and material requirement
All data is held at individual schedule level. So, if data is to change it can be processed against the data known at the time. Sequence dependant changeovers are also held at individual schedule level, to reduce the amount of data that is required to be retained to achieve the desired result.
Organisation usage
Providing the user has the correct level of access, here they can see the details of how often the EvoAPS has been used, how long process have taken and how many tokens have been consumed.

Ready to Rethink Scheduling?
Join the manufacturers leading the way into a new era of planning and scheduling.